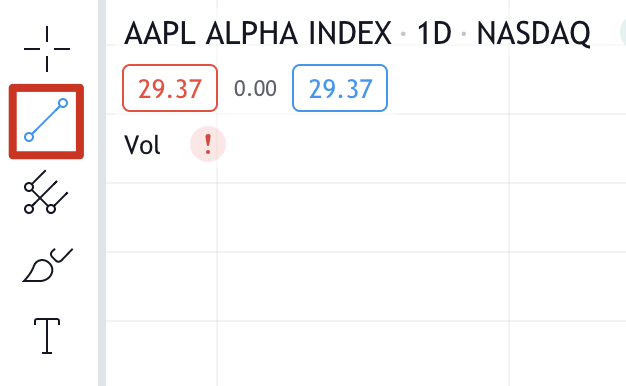
1. To start the tutorial, select the line tool from the left side toolbar.

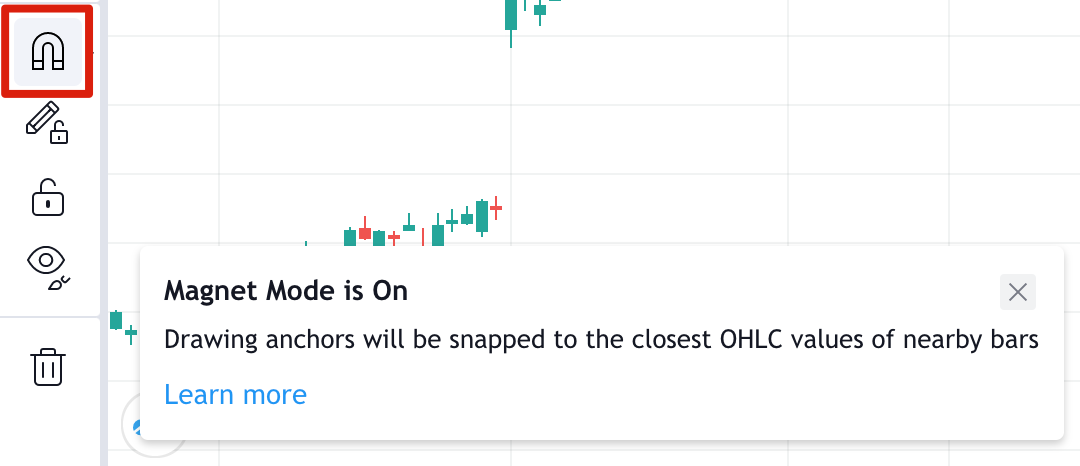
2. You also might want to turn on the magnet tool. Your lines will snap to any nearby OHLC points, which is helpful for improved accuracy.
3. For a downtrend, start at a local high point (point 1) before a price dip, known as a swing high. Click where you want the line to start and try to include as many highs as possible. Click again when you want to complete your trend line.
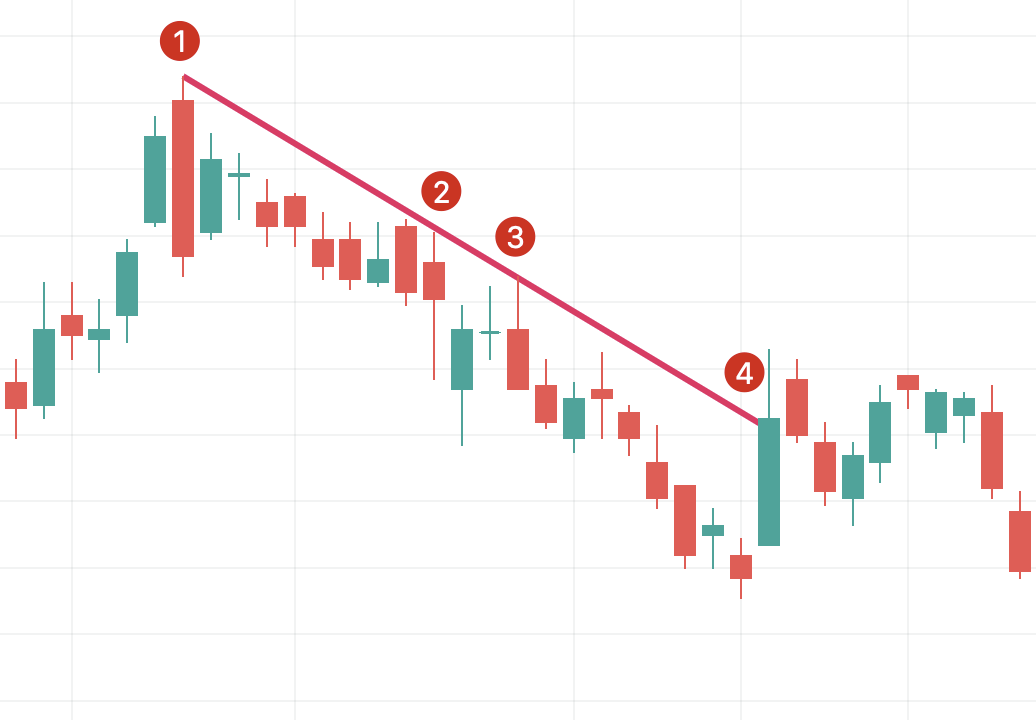
Points 1, 2, and 3 indicate points of resistance. It’s always best to have at least three points testing your trend line, as two points could be coincidental. Point 4 shows a breakout from the trend, meaning that it’s best to draw a new trend line.
Once you have an established downtrend, one possible strategy is to sell when the price meets and tests your line. If you decide to draw an uptrend, make sure you start your line using a low price so that the line is underneath your candlestick.
Drawing a pitchfork
A pitchfork is a more advanced chart that develops the trend line concept. The technical indicator was created by Alan Andrew, a famous 20th-century American investor and educator. It’s easy to draw and provides more insight than a simple trend line, so let’s go through it step-by-step.
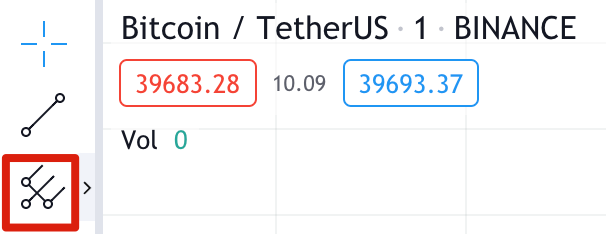
1. To begin, select the pitchfork tool underneath the line tool.
2. We’re going to create our pitchfork by picking three points at the beginning and end of trends.
3. You can see in the example below that we’ve started with point 1, the swing low of a downtrend. We’ve then clicked point 2, the swing high of an uptrend, followed by point 3, the swing low of the next downtrend.
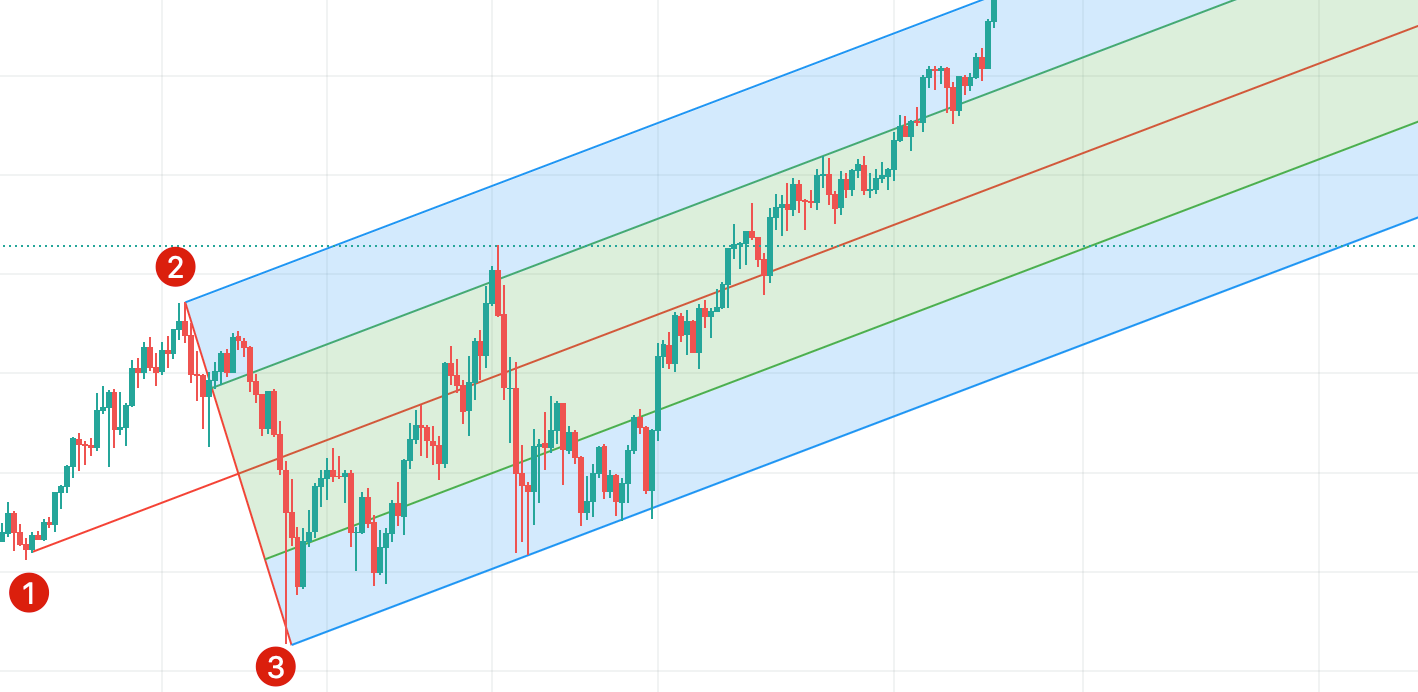
4. These points create a pitchfork shape, with the top line extending from point 2 showing the resistance level and the bottom line extending from point 3 showing the support level. The median line is where the price is expected to gravitate towards.
5. Similar to our trendline example, the support line shows possible areas to buy and the resistance line where you could sell. You could also place a stop-loss order just below the bottom trendline as a risk management method. Note that, just like any other indicator, pitchfork won’t always work as expected. Consider combining it with other tools and strategies to reduce the risks.