Course Content
How To Create TA Indicators on TradingView
Without the right trading tools, you can’t conduct effective technical analysis. A strong trading strategy will help you avoid common mistakes, improve your risk management, and increase your ability to identify and take advantage of opportunities. For many, TradingView is the go-to charting platform. Offering a hub of technical analysis tools, the powerful HTML5 web application is used by millions to track movements in the Forex, cryptocurrency, and traditional stock markets. TradingView has many powerful features: it allows us to track assets across numerous trading platforms and to publish trading ideas within its social network. In this article, we’ll focus on its customizability. We’ll be using Pine Script, TradingView’s own programming language, which grants us granular control over our chart layouts. Let’s get started!
0/8
How To Create TA Indicators on TradingView
About Lesson
We’ve got some of the basics down. Let’s move on to our first custom indicator – the exponential moving average, or EMA. This is a valuable tool as it allows us to filter out any market noise and smooth out price action. 
EMA differs slightly from the simple moving average (SMA), in that it puts more weight in the most recent data. It tends to be more reactive to sudden movements and is often used for short-term plays (in day trading, for example).

The simple moving average (SMA)

We might as well plot the SMA, just so we can compare the two after. Add this line to your script:

plot(sma(close, 10))

This plots the average of the previous ten days. Tweak the number in the brackets to see how the curve changes when taking into account different lengths.

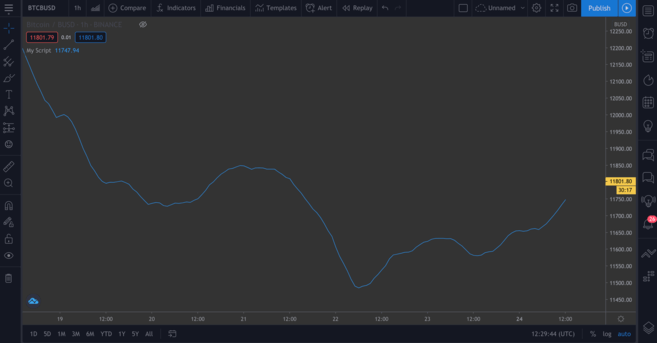
The SMA, based on the previous ten days.

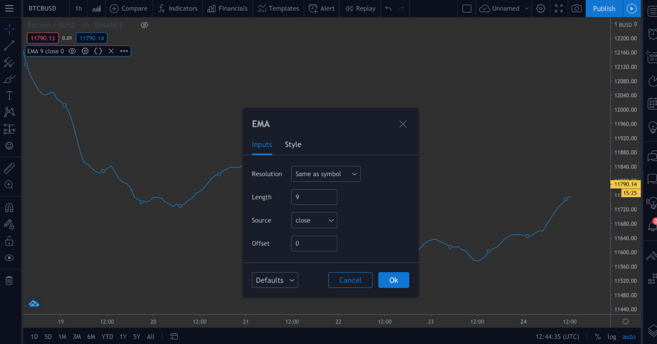
The exponential moving average (EMA)

The EMA will be a bit trickier to understand, but not to worry. Let’s break down the formula first:

EMA = (Close - Previous Day’s EMA) * Multiplier - Previous Day’s EMA

So, what’s this telling us? Well, for each day, we calculate a new moving average based on the previous day’s one. The multiplier is what “weighs” the most recent period, and is calculated with the following formula:
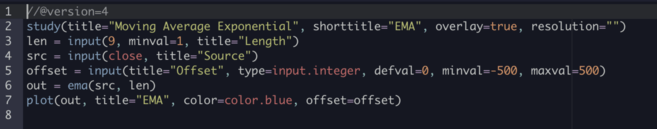
Multiplier = 2 / (Length of EMA + 1)

As with simple moving averages, we need to specify how long the EMA will be. Syntactically, the function to plot EMA is similar to the SMA one. Plot it alongside the SMA so you can compare the two:

//@version=4
study("My Script", overlay=true)
plot(sma(close, 10))
plot(ema(close,10))

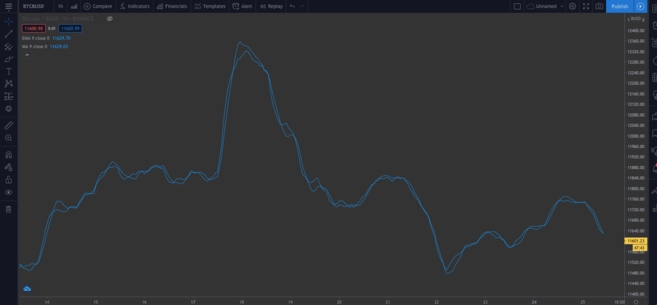
You can see a slight difference in the two types of MA.

Built-in scripts

So far, we’ve written our code manually so you can get a feel for it. But let’s introduce something that can save us time, particularly if we’re writing more complex scripts, and we don’t want to do them from scratch.

On the top, right-hand side of your editor, click on New. You’ll get a dropdown menu with all kinds of different technical indicators. Click Moving Average Exponential to see the source code for an EMA indicator.

Go ahead and add this to the chart.

This one is different from ours – you’ll notice the input() functions. These are nice from a usability perspective since you can click on this box…
…and easily change some of the values in a pop-up window by clicking on the Settings wheel.
We’ll add a couple of input() functions in our next script to demonstrate this.