Posted by: Shannon Williams PERT chart vs Gantt chart differences PERT charts: Utilized before a project begins to plan and determine the duration of each task Gantt charts: Used while a project is happening to break projects into smaller tasks and highlight scheduling constraints When you and your team need to complete a project, you’ll realize […]
Posted by: Lucid Content Team Think back to memorizing major events in your history class (we apologize in advance for any painful memories this exercise might resurface). Rather than stare at a jumble of dates in your textbook, you likely found or created a timeline clearly spelling out what happened when. While you may not have […]
Steve Jobs, the genius behind Apple’s one-of-a-kind customer experience, said, “You’ve got to start with the customer experience and work back toward the technology, not the other way around.” Nowadays, a clear vision and strategy for customer interactions is no longer an optional “nice-to-have”—it’s essential. As you refine your customer experience, one of the most […]
Posted by: Shannon Williams Recruitment Process Flowchart The best way to document and implement your recruitment process is with a recruitment process flowchart. Sometimes referred to as a recruitment workflow, recruitment process flowcharts map out the recruiting process. Recruitment involves many people, and visualizing your process can help keep everyone on the same page and communicate […]
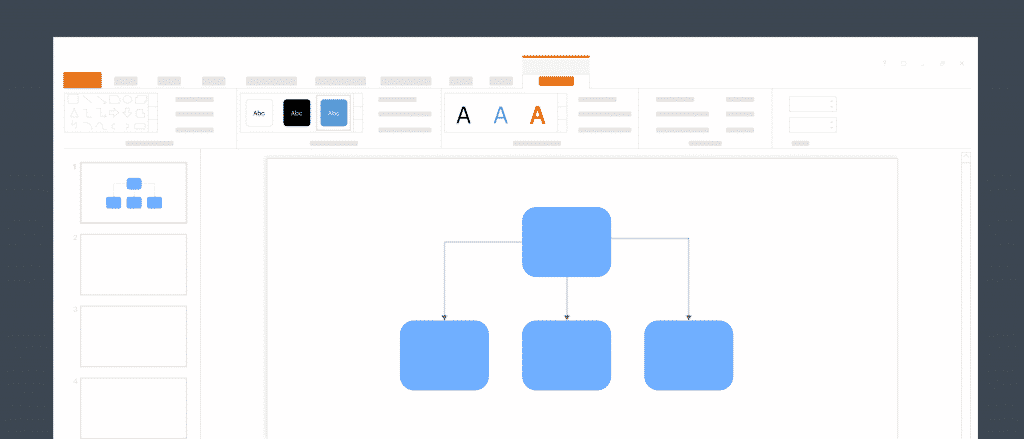
Posted by: Lucid Content Team It’s T-37 minutes until your big presentation, and you’re still scrambling to get your flowchart to look right in PowerPoint. You’d scrap the flowchart slide all together, but unfortunately it’s the crux of your whole presentation. With every tick of your watch, selling everything you own and traveling to Cambodia to […]
Posted by: Lucid Content Team Venn diagram symbols ∪: Union of two sets. A complete Venn diagram represents the union of two sets. ∩: Intersection of two sets. The intersection shows what items are shared between categories. Ac: Complement of a set. The complement is whatever is not represented in a set. It’s time to have a serious talk […]
Organizational charts are an essential part of operations for any business. Clearly delineating the chain of command shows employees what is expected of them and where they can turn for help. Org charts can also help leadership identify bottlenecks in corporate structure so they can maximize efficiency and output. There’s just one issue. Many employees […]
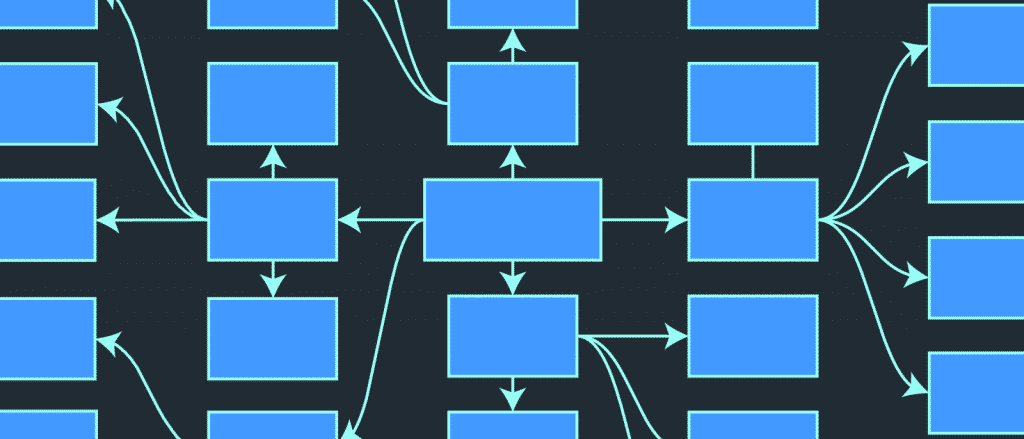
5 easy steps for drawing a concept map Select a drawing medium Establish a main concept Identify related concepts Organize shapes and lines Fine-tune the map *Originally created by lucidchart.com
