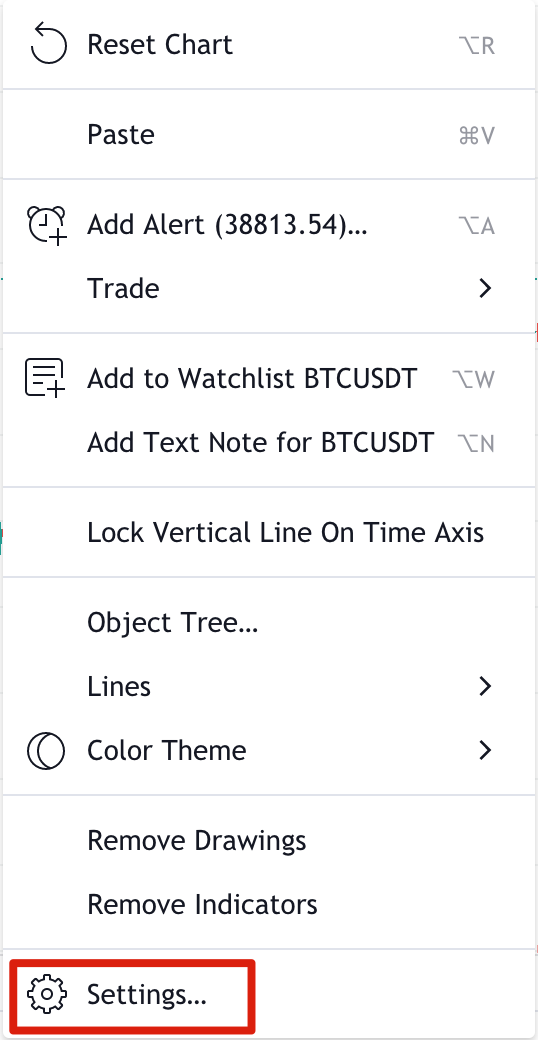
Everyone has their preferences when it comes to chart layout. Customizing colors, lines, and axes makes it easier to read and understand your graphs quickly. You can find all the options you’ll need by right-clicking the graph area and clicking [Settings…].
You can also reset your chart if it gets messy and set custom email price alerts from the [Settings…] menu.

Once you’ve clicked [Settings…] you’ll find yourself in the [Chart settings] window where you can play with a range of options. Let’s quickly go through the basics.
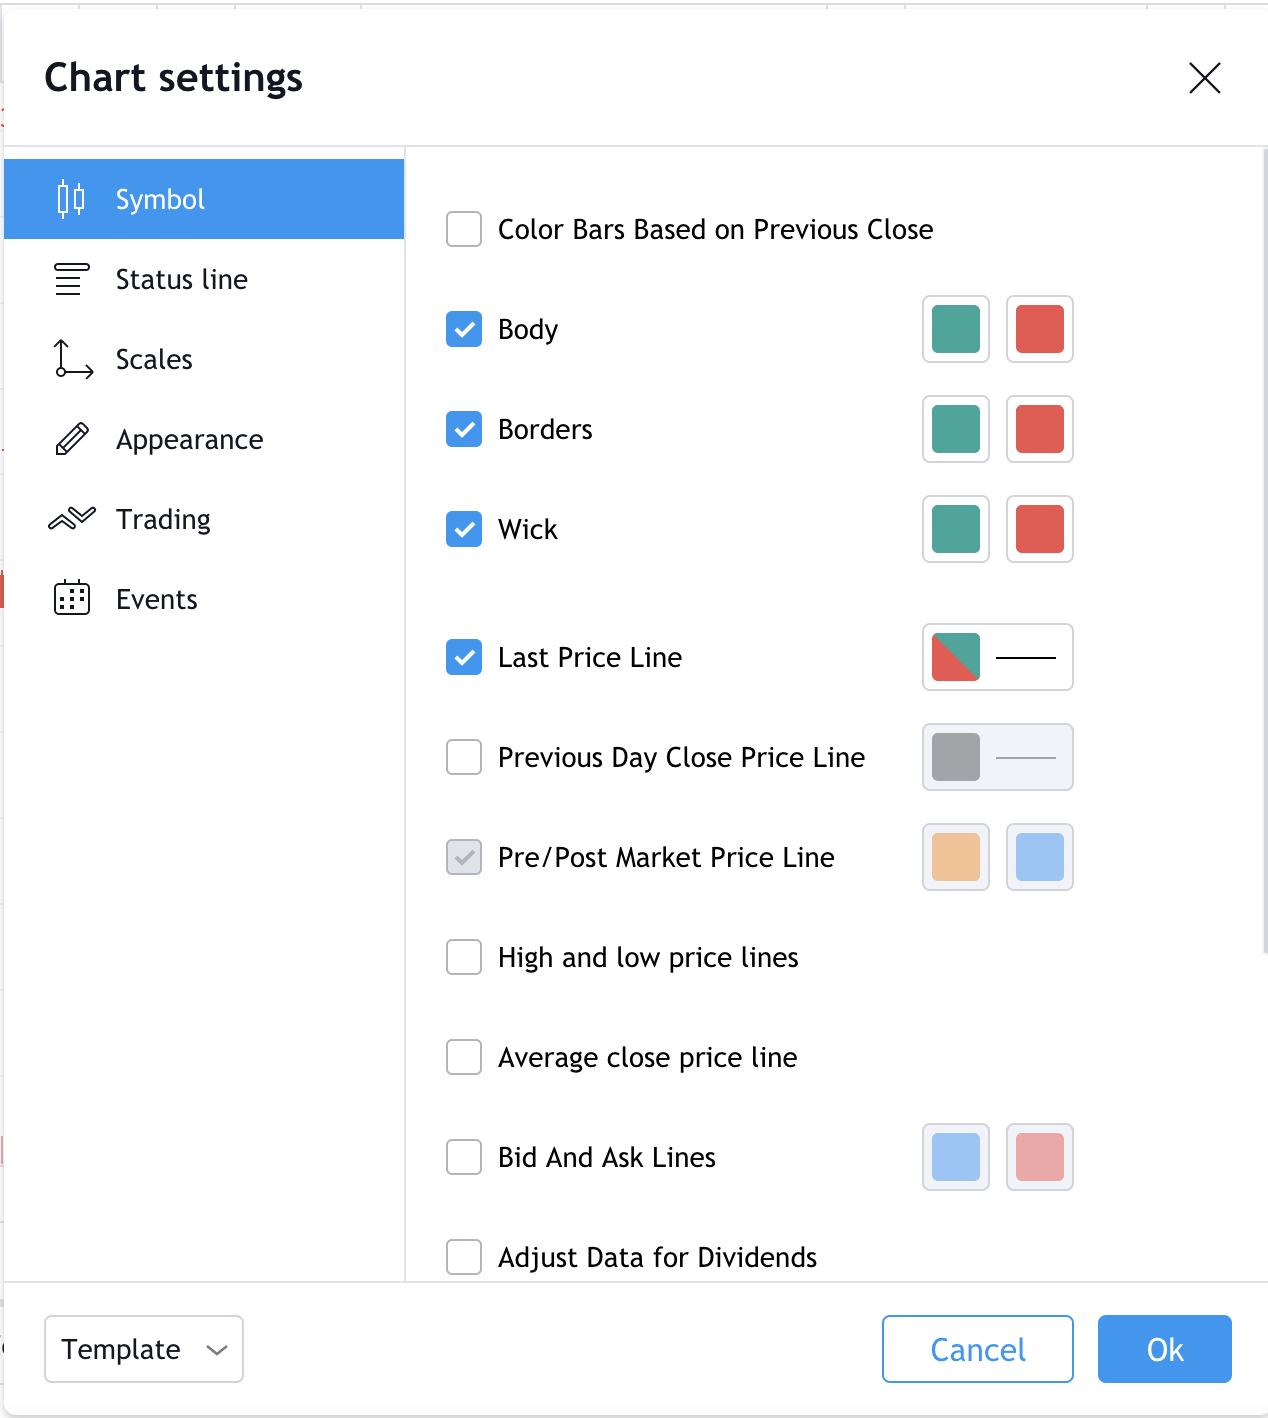
1. [Symbol] lets you change the way that your candlestick charts look. Every part of the candlestick pattern can be color-coded the exact way you like.

3. [Scales] provides options to change the trackers you can see on the right-hand axis. For example, you could add the day’s high and low prices or the countdown to bar close.
4. [Appearance] lets you change your grid lines, background color, axes, and other cosmetic features.
5. [Trading] allows you to customize visual elements if you’ve logged into a broker account.
6. [Events] gives you options to display dividends, splits, and other events on the chart area.
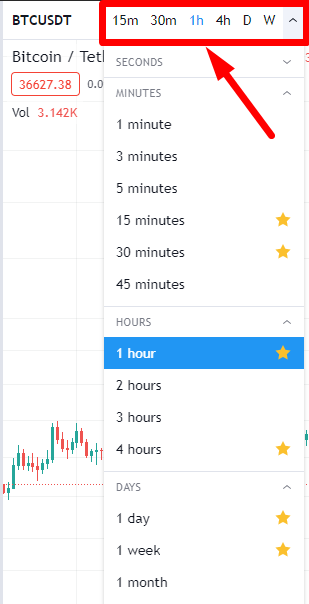
Along with setting up the chart view, you might also want to change the intervals of your candlesticks or other symbols. To do this, go to the top bar and click the far left button. You’ll now find a long list of different intervals, ranging from seconds to months. You can also favorite some intervals so they will show up on your top bar.
Once you start customizing your chart, there’s no need to save it manually. TradingView saves all your edits in real-time, so you can log out and come back to them later.