If you’ve never used charting tools before, TradingView can look a bit confusing. Let’s break it down a bit first.

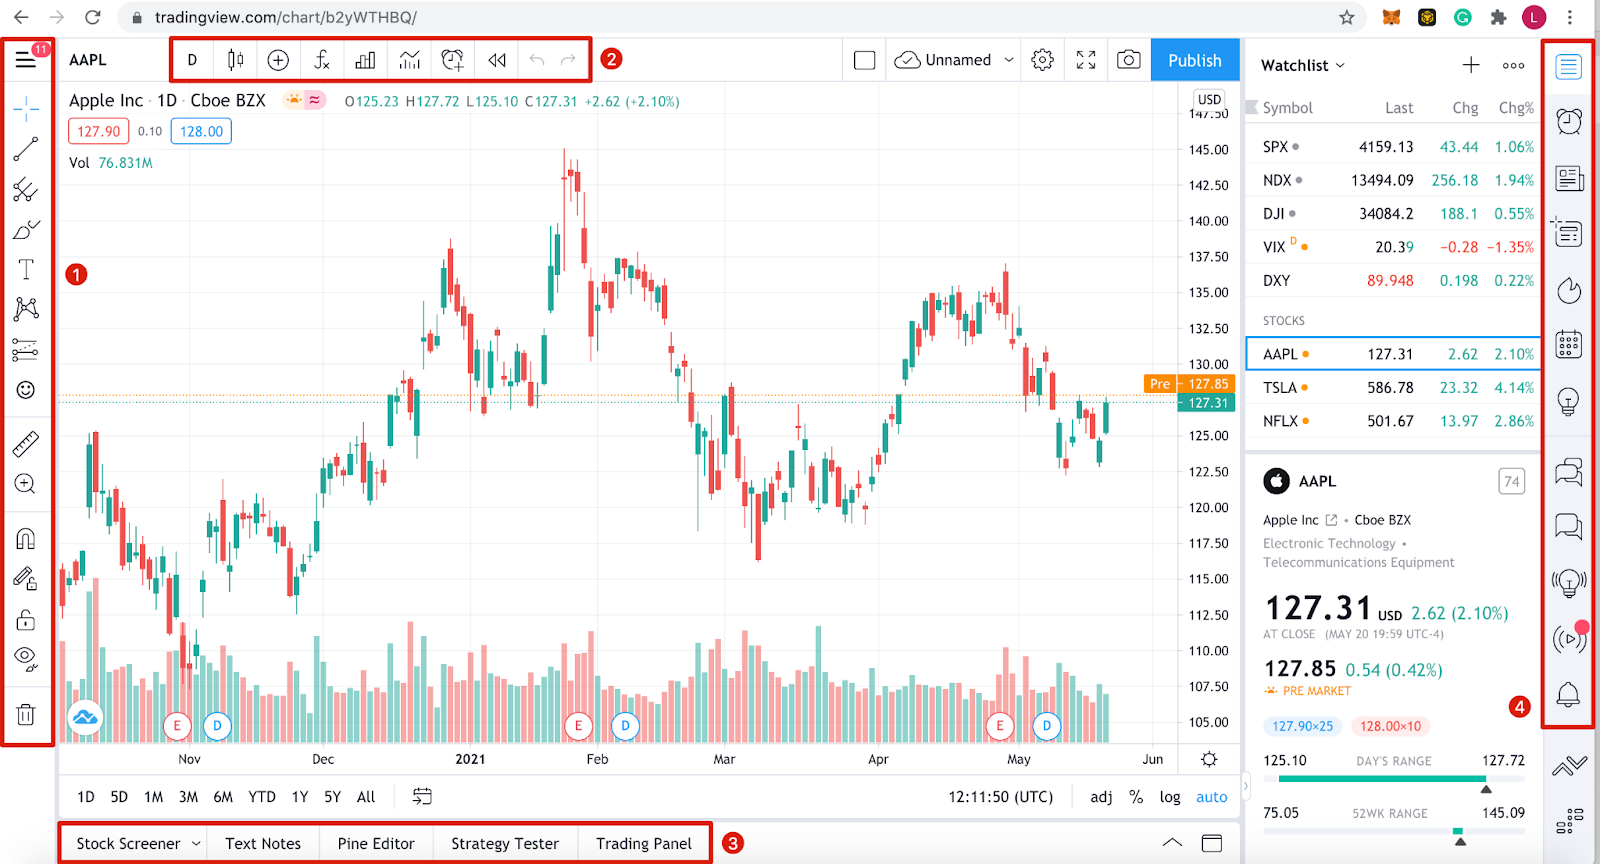
Toolbar 1
Toolbar 2
Here you’ll find options to change the look of the chart. You can choose between candlesticks, line graphs, area graphs, and more. There’s also a search bar to the left to change the asset displayed. Another tool to note is the [Indicators & Strategies] button to insert premade analysis patterns like a moving average.
Toolbar 3
TradingView doesn’t offer a brokerage service, but you can trade within the website using the [Trading Panel] tab. You’ll find a list of partners you can exchange with if you already have an open account with them. You can also backtest your strategies using the [Strategy Tester] function.
Toolbar 4
This section mainly covers news and TradingView’s social elements. You can customize your watchlist, private message other users, explore Ideas and Streams, and access a personalized calendar. If you need to find any data, lists, or information, this is the area to visit.
Chart area
When you change the asset you’re looking at, use any tools, or place indicators, you’ll find them displayed in the main chart area. You can also customize almost everything you see, which we’ll cover in the next section.