Course Content
How To Create TA Indicators on TradingView
Without the right trading tools, you can’t conduct effective technical analysis. A strong trading strategy will help you avoid common mistakes, improve your risk management, and increase your ability to identify and take advantage of opportunities. For many, TradingView is the go-to charting platform. Offering a hub of technical analysis tools, the powerful HTML5 web application is used by millions to track movements in the Forex, cryptocurrency, and traditional stock markets. TradingView has many powerful features: it allows us to track assets across numerous trading platforms and to publish trading ideas within its social network. In this article, we’ll focus on its customizability. We’ll be using Pine Script, TradingView’s own programming language, which grants us granular control over our chart layouts. Let’s get started!
0/8
How To Create TA Indicators on TradingView
About Lesson

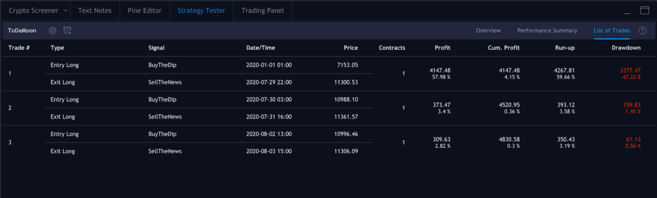
There is a way for us to test our custom indicators. Though past performance is no guarantee of future results, backtesting our scripts can give us an idea of how effective they are at picking up signals. 

We’ll give an example of a simple script below. We’re going to create a straightforward strategy that enters a long position when the BTC price falls below $11,000 and exits the position when the price exceeds $11,300. We can then see how profitable this strategy would have been historically.

//@version=4
strategy("ToDaMoon", overlay=true)
enter = input(11000)
exit = input(11300)
price = close

if (price <= enter)
    strategy.entry("BuyTheDip", strategy.long, comment="BuyTheDip")
if (price >= exit)
    strategy.close_all(comment="SellTheNews")
Here we’ve defined entry and exit as variables – both are inputs, meaning that we can change them on the chart later. We also set up the price variable, which takes the close for each period. Then, we have some logic in the form of if statements. If the part in brackets is true, then the indented block beneath it will be run. Otherwise, it will be skipped.

So, if the price is less than or equal to our desired entry, the first expression evaluates as true, and we’ll open a long position. Once the price equals or exceeds the desired exit, the second block will be triggered, closing all open positions. 

We’ll annotate the chart with arrows that show where we’ve entered/exited, so we’ve specified what to label these points with the comment parameter (in this example, “BuyTheDip” and “SellTheNews”). Copy the code, and add it to the chart.

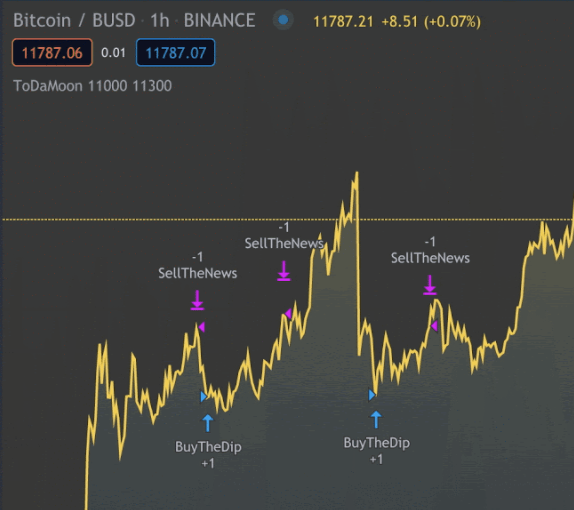
You can now see the indicators on the chart. You might need to zoom out.

TradingView automatically applies your rules to older data. You’ll also notice that it switches from the Pine Editor to the Strategy Tester tab. This allows you to see an overview of your potential profits, a list of trades, and each of their individual performances.

Positions we’ve entered and exited.