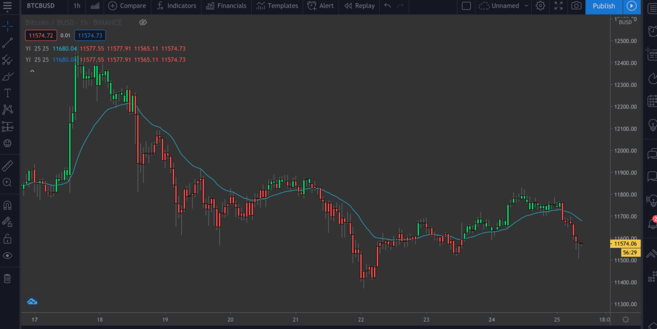
Time to write our own script by using some of the concepts we’ve seen so far. We’re going to combine EMA and RSI and use their values to color candlesticks, yielding insights that we can easily visualize.
This shouldn’t be construed as financial advice – there’s no objectively correct way to use this indicator. As with all others, it should be used with other tools to develop your own strategy.
Now let’s work on our new script. Remove all your indicators from the chart, and hide the Bitcoin/BUSD chart, too, so that we have a clean canvas to work on.
study(title="Binance Academy Script", overlay=true)study(title="Binance Academy Script", overlay=true)
emaLength = input(title="EMA Length", type=input.integer, defval=25, minval=0)Using this new variable, we can calculate the EMA value for each candle in our chart:
study(title="Binance Academy Script", overlay=true)
emaLength = input(title="EMA Length", type=input.integer, defval=25, minval=0)
emaVal = ema(close, emaLength)Great. Onto the RSI. We’ll give it a length in a similar way:
study(title="Binance Academy Script", overlay=true)
emaLength = input(title="EMA Length", type=input.integer, defval=25, minval=0)
emaVal = ema(close, emaLength)
rsiLength = input(title="RSI Length", type=input.integer, defval=25, minval=0)And now, we can calculate it:
study(title="Binance Academy Script", overlay=true)
emaLength = input(title="EMA Length", type=input.integer, defval=25, minval=0)
emaVal = ema(close, emaLength)
rsiLength = input(title="RSI Length", type=input.integer, defval=25, minval=0)
rsiVal = rsi(close, rsiLength)At this stage, let’s put together the logic that colors the candlesticks depending on the EMA and RSI values. Let’s take a situation where (a) the close price of the candle exceeds the EMA and (b) where the RSI is above 50.
So, our next line will look like this:
study(title="Binance Academy Script", overlay=true)
emaLength = input(title="EMA Length", type=input.integer, defval=25, minval=0)
emaVal = ema(close, emaLength)
rsiLength = input(title="RSI Length", type=input.integer, defval=25, minval=0)
rsiVal = rsi(close, rsiLength)
colors = close > emaVal and rsiVal > 50 ? color.green : color.redNext, plot the EMA:
study(title="Binance Academy Script", overlay=true)
emaLength = input(title="EMA Length", type=input.integer, defval=25, minval=0)
emaVal = ema(close, emaLength)
rsiLength = input(title="RSI Length", type=input.integer, defval=25, minval=0)
rsiVal = rsi(close, rsiLength)
colors = close > emaVal and rsiVal > 50 ? color.green : color.red
plot(emaVal, "EMA")study(title="Binance Academy Script", overlay=true)
emaLength = input(title="EMA Length", type=input.integer, defval=25, minval=0)
emaVal = ema(close, emaLength)
rsiLength = input(title="RSI Length", type=input.integer, defval=25, minval=0)
rsiVal = rsi(close, rsiLength)
colors = close > emaVal and rsiVal > 50 ? color.green : color.red
plot(emaVal, "EMA")
plotcandle(open, high, low, close, color=colors)And that’s the script! Add it to the chart to see it in action.
A BTC/BUSD chart with the EMA/RSI indicator.
